
|
The explosion in usage of personal wearable devices is reshaping health monitoring. You would have observed your smartwatch or ring providing you with trends for Resting Heart Rate (RHR), Heart Rate Variability (HRV), and a spectrum of other digital biomarkers.
Imagine this scenario:
Your wearable device reports an average RHR of 57 for October, down from 60 in September, while your HRV jumps from 88 ms to 101 ms in the same period.
How should this data be interpreted?
A reduction in RHR alongside increased HRV may suggest improved cardiovascular fitness, greater resilience to stress, and better recovery—signals that the body’s autonomic nervous system is adapting positively. This is the kind of insight that empowers proactive health decisions.
With the above snapshot, how do you think an ECG waveform differ between a heartbeat of 57 bpm versus 60 bpm?
The numbers tell a story that is rooted in science.
Some of the questions that needs to be thought through -
If RHR is at 57 bpm, how would this waveform look like to that of 60 bpm?
How would the voltage look like? Would a 57 bpm have a higher peak than that of 60 bpm OR is the voltage independent ?
Where is the Heart rate variability (HRV) indicated in this waveform?
Let's dive a little deeper here.
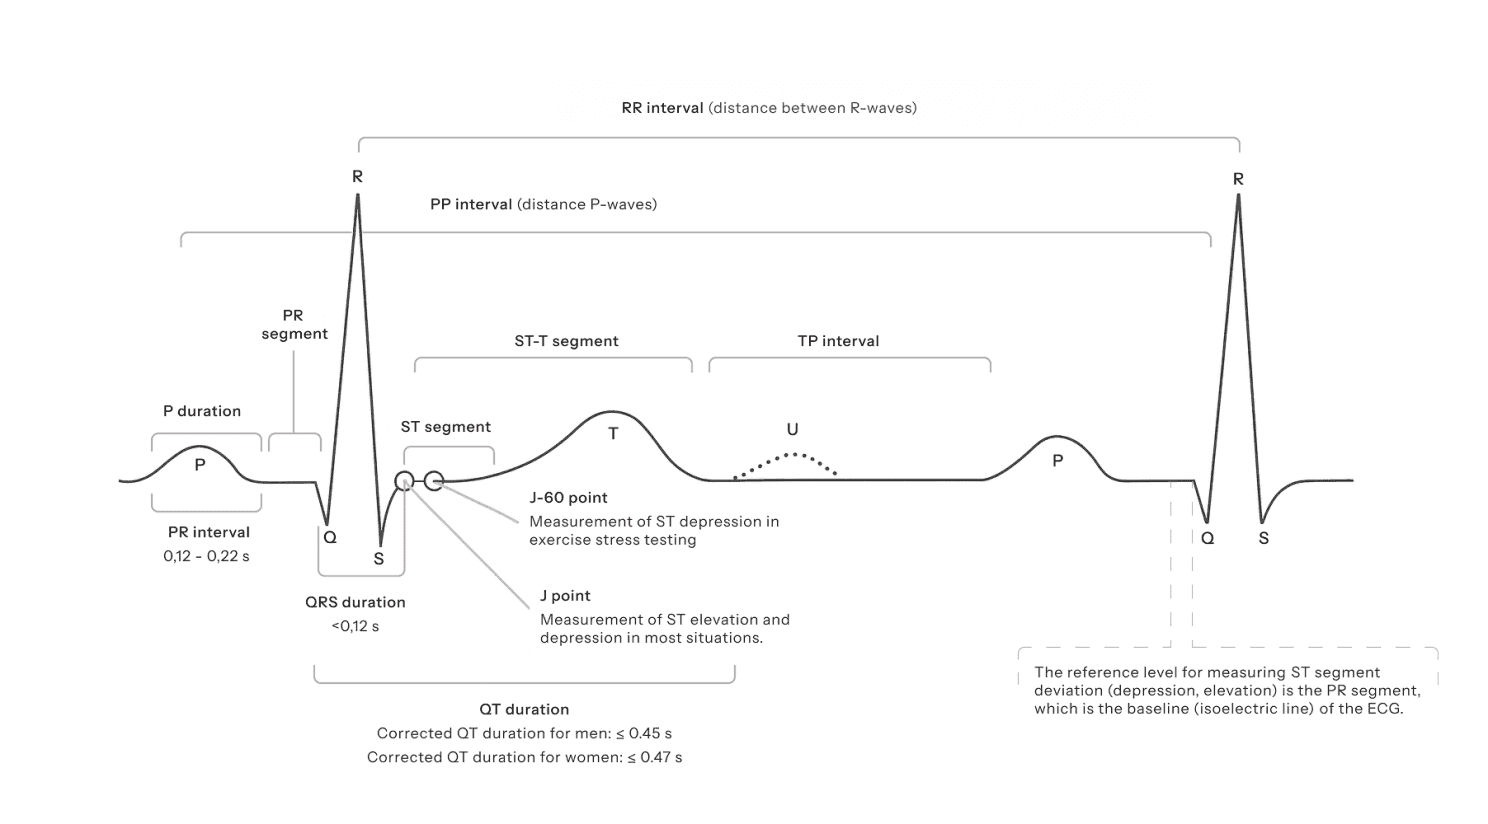
All muscles, including the muscles of the heart, are activated by electrical impulses. The higher the voltage, the stronger is the heartbeat (there is a threshold). After the muscles have executed their effort, they need time to relax and get ready for the next round of work.
In the ECG waveform, the peak voltage is at P in the QRS complex. With the x-axis restricted to 60 secs (1 min), a 57 bpm waveform will have a larger RR interval to the 60 bpm i.e the heart gets a longer duration of time to recover before starting its next cycle.
Understanding Heart Rate Variability (HRV)
In the same ECG, all of the RR intervals are computed. This becomes the basis for computing HRV. The time intervals between consecutive heartbeats are called Interbeat Intervals (IBI). The human body is always exposed to physical and psychological challenges to homeostasis (equilibrium state), even while sleeping. This is a mathematical chaos of numbers to understand.
Using time-domain measures such as Standard Deviation, Mean of Standard Deviation on RR intervals such as SDRR, RMSSD and others, the variability of the heartbeats can be quantified. This is expressed in milliseconds (ms), which is the time-domain. In understanding HRV, a number of 101 ms compares better to 88 (there are thresholds).
It is always desirable to measure HR and HRV when the body is relaxed and there is significant drop in physical and psychological challenges.
The body being a complex mechanism, it is imperative that no single metric is analyzed in isolation.
Looking beyond HR, RHR and HRV.
The future of health monitoring techniques are advancing very fast. Innovative techniques, such as nanosensors placed discreetly behind the ear, can allow real-time tracking of mental clarity. Atlas has recently announced a sizeable funding and is expected to launch in 2026. Nearby home in India, Neuro-stellar is working in the same space of understanding mental wellness.
There is a compelling opportunity to correlate mental clarity with biometric data—envisioning a use case where enhanced cognition aligns with lower RHR and higher HRV.
Recording, analyzing and understand the interplay between EEG and ECG, now possible with advancement of wearable devices, helps in a holistic neurological-cardiac assessment.